Infographics and Essays: Blending Visual Data with Textual Analysis
By Mohamed IDBRAHIM - October 15, 2026 - 4 min read
Introduction
In today's information-rich world, we often need to combine pictures, charts, and words to tell a complete story. Infographics present data visually, while essays use words to analyze and persuade. When you blend them, you create powerful communication. This article will help you understand and use the vocabulary around infographics and essays, so you can discuss, create, and critique them with confidence.
Definition
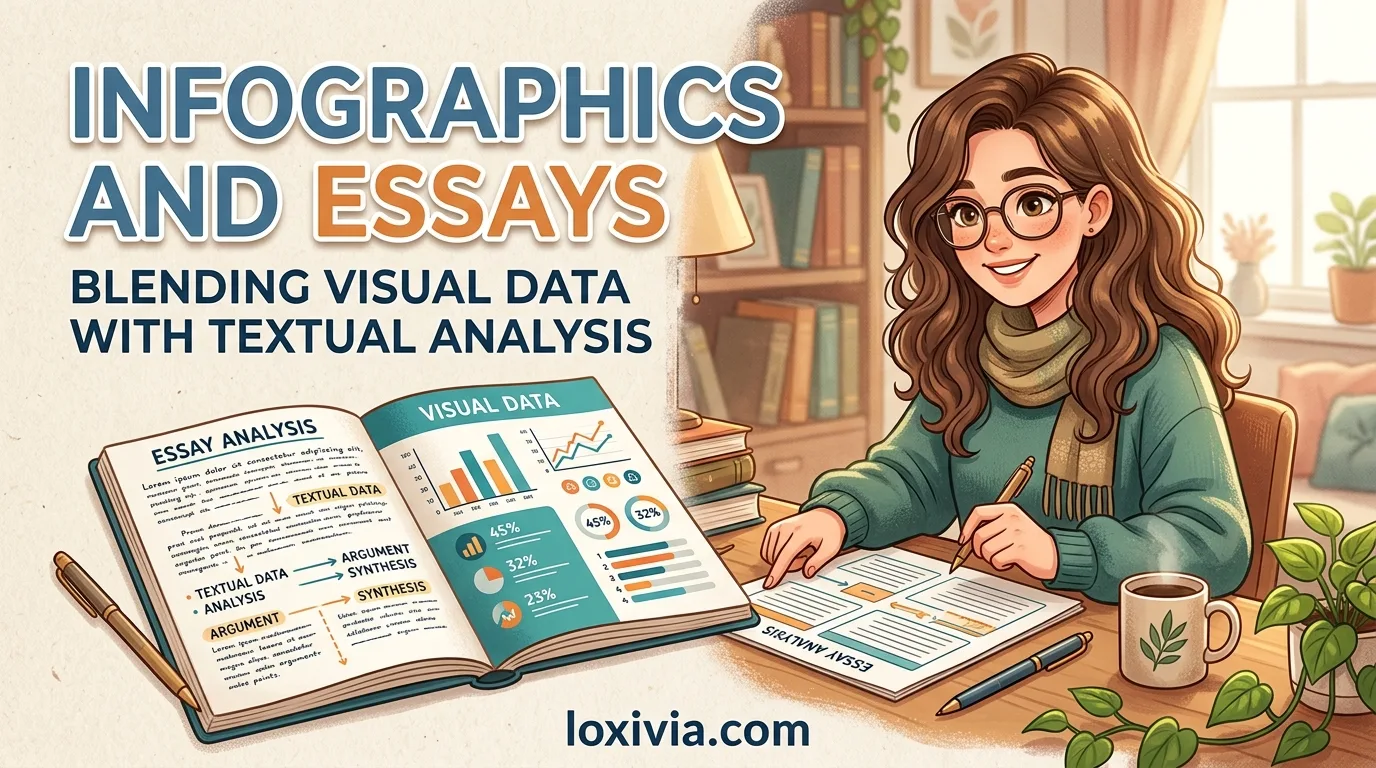
An infographic is a visual representation of information or data. It uses elements like charts, graphs, icons, and short text to make complex ideas easy to understand. An essay is a written piece that presents a focused argument or analysis on a topic. Blending visual data with textual analysis means combining the strengths of both: using visuals to show patterns and using text to explain, interpret, and connect those patterns to a larger idea.
Synonyms and Nuances
| Synonym | Nuance | Register |
|---|---|---|
| Data visualization | Focuses on charts and graphs, often interactive | Technical, academic |
| Visual story | Emphasizes narrative and emotional impact | General, media |
| Written analysis | Stresses the text's role in interpreting | Academic, formal |
| Infographic essay | A hybrid form that mixes both | Modern, informal |
Collocations
| Collocation | Example |
|---|---|
| create an infographic | She created an infographic to summarize the survey results. |
| write an essay | He wrote an essay on climate change. |
| blend visuals with text | The report blends visuals with text seamlessly. |
| analyze data | We need to analyze the data before making conclusions. |
| present findings | The infographic presents the findings clearly. |
| support an argument | The essay supports its argument with statistics. |
Example Sentences
- The infographic uses a bar chart to show the increase in sales, while the essay explains the reasons behind the trend.
- In her essay, she blends statistical data with personal stories to make a compelling case.
- A good infographic should be self-explanatory, but an essay requires careful reading.
- The website features an infographic essay that combines interactive maps with detailed textual analysis.
- To create an effective infographic, you must first analyze your data and decide on the key message.
Common Mistakes
- Confusing infographics with essays: An infographic is primarily visual; an essay is primarily textual. They serve different purposes.
- Overloading visuals: Too many charts and icons can confuse readers. Keep it simple.
- Ignoring the text: In a blended piece, the text should not just repeat the visuals; it should add interpretation.
- Using informal language in essays: Essays usually require a formal tone, while infographics can be more casual.
- Forgetting to cite sources: Always give credit for data and images.
Word Family
| Noun | Verb | Adjective | Adverb |
|---|---|---|---|
| infographic | infograph (rare) | infographic | infographically (rare) |
| essay | essay | essayistic | essayistically |
| analysis | analyze | analytical | analytically |
| visualization | visualize | visual | visually |
Mini Practice Quiz
- What is the main difference between an infographic and an essay?
- Fill in the blank: The report ______ visual data with textual analysis.
- True or false: An infographic essay should only use visuals.
Answers:
- An infographic is primarily visual, while an essay is primarily textual.
- blends
- False. It should blend both.
FAQ
Q: Can an infographic replace an essay? A: No, they serve different purposes. An infographic is great for quick insights, but an essay provides deeper analysis and argument.
Q: How do I start blending visuals with text? A: Begin by outlining your key points. Decide which points are best shown visually (e.g., trends, comparisons) and which need explanation in text.
Q: Is an infographic essay a formal academic genre? A: It is becoming more common in digital media and some academic contexts, but traditional essays are still more formal. Check your assignment guidelines.
Visual Example
This diagram shows that an infographic relies on visual elements like shapes and colors, while an essay relies on lines of text. When blended, they form a powerful combination.
Conclusion
Mastering the language of infographics and essays will help you communicate more effectively in academic and professional settings. Practice using the vocabulary and structures from this article, and soon you will be blending visual data with textual analysis like a pro.